On the Nested Relationships of the Intelligent Consortium’s Intelligent Network
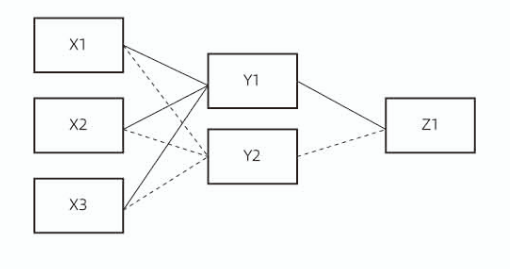
This section provides a simple diagrammatic case study of the relationship between driving nodes and action nodes described above:
In the simplified network structure shown above, there are six nodes: X1, X2, X3, Y1, Y2, and Z1. In this network (referred to as Network A), Z1 is the action node, and the remaining five are driving nodes. Within Network A, two subdivided networks, B1 and B2, can be identified. Network B1 includes nodes X1, X2, X3, and Y1, with Y1 as the action node and the other three as driving nodes. Network B2 includes nodes X1, X2, X3, and Y2, with Y2 as the action node and the other three as driving nodes. This demonstrates the nested relationship, where Networks B1 and B2 are embedded within Network A. Although X1, X2, and X3 are depicted as terminal driving nodes in the diagram, in the intelligent structure, they can be further subdivided into smaller nested networks. For the sake of this chapter, the decomposition stops at the X-level nodes. In this example, Y1 is both a driving node in Network A and an action node in Network B1. However, Y1’s driving role in Network A is provided by its role as an action node in Network B1. For instance, Z1 could be the head chef of a restaurant organization, responsible for managing dish production and developing menus. Network A is the organizational network with the head chef as the action node. Y1 is a consumer opinion leader group, and Y2 is the team leader for procurement. The procurement team, through its leader, provides the head chef with information on raw material supply and availability during different periods. The opinion leader group provides ongoing customer feedback and suggestions for adjustments. Both the procurement leader and the opinion leader influence the head chef (Z1) through their roles as action nodes in their respective subnetworks B1 and B2. However, their ultimate role in affecting the head chef’s behavior is as driving nodes, with the head chef’s actions being the output of Network A.
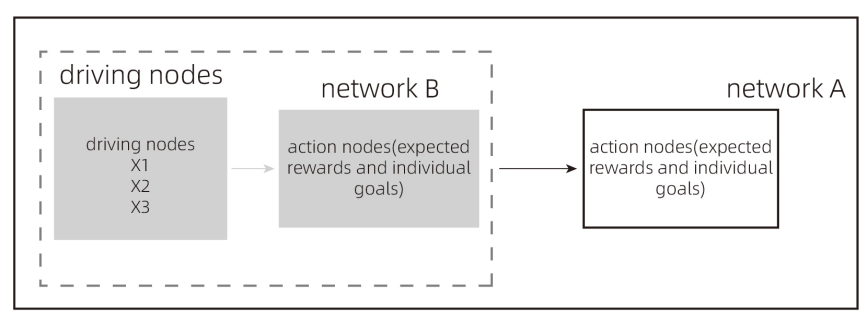
The following diagram illustrates a more specific nested structure, showing Network A’s nesting of Network B: